CHECK VSAN HEALTH
Step 1: Connect to an ESXi via SSH with root credentials.
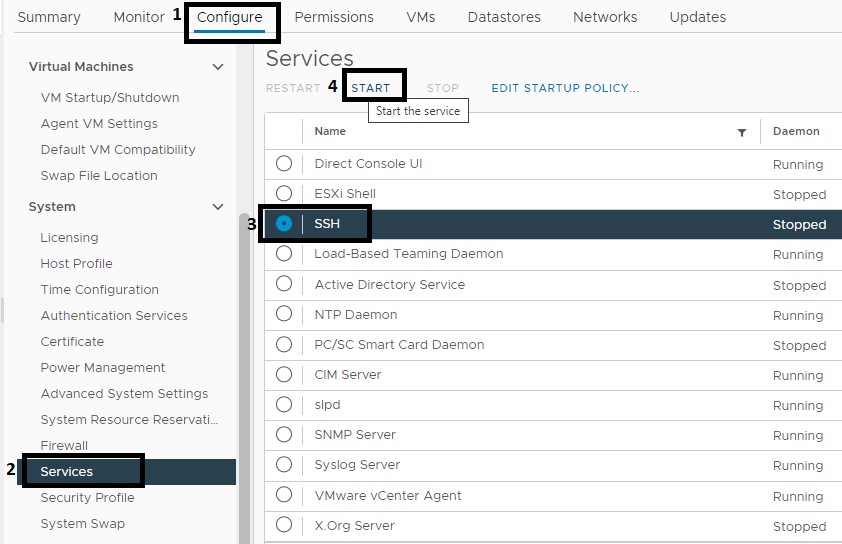
In this step, it is important to previously enable the SSH service on the ESXi, which is done from the Configure>Services tab, then select SSH and click START at the top.
The following image details the step by step:
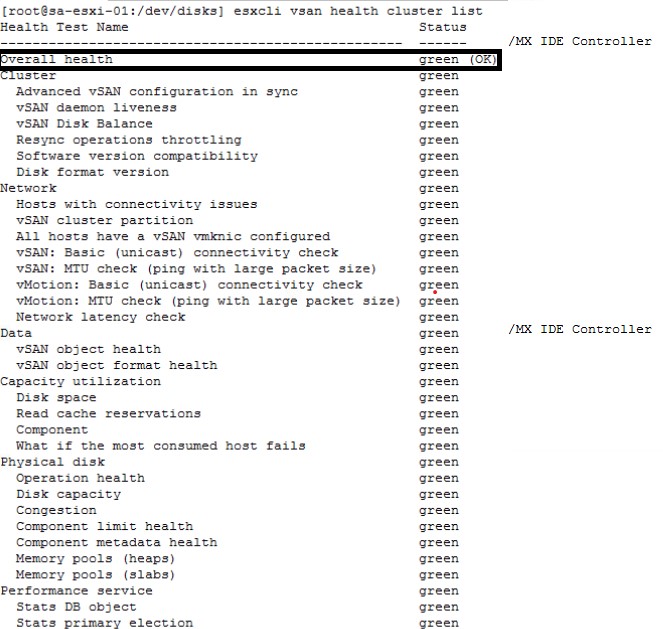
Step 2: After connecting to the ESXi, we validate the health status of the vSAN by running the following command:
esxcli vsan health cluster list
This command is similar to the Skyline Health that is run from the vCenter Server and allows us to know how the vSAN is in the following levels:
- Overall
- Cluster
- Network
- Data
- Capacity Utilization
- Physical disk
- Performance services.
Generally speaking, when the vSAN is healthy, all values should be in green exactly as shown in the following image:
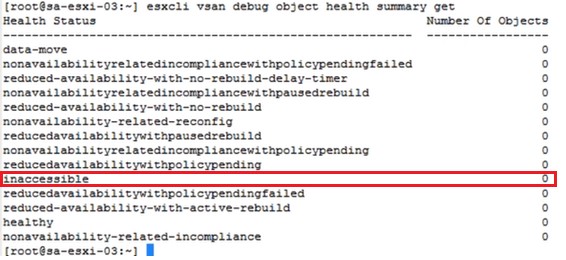
Step 3: Check the health status of the vSAN objects, which allows us to know how they are and if there are inaccessible objects. To do this, we execute the following command:
esxcli vsan debug object health summary get
It is important to highlight that all the values of the command output must be zero.
The following image shows a real example, where it can be seen that there are zero inaccessible objects, which indicates that the vSAN is healthy at the object level:
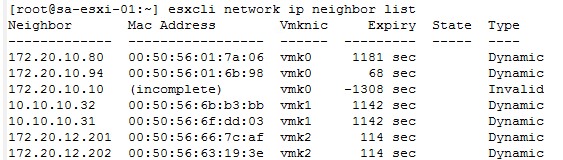
Step 4: Check the communication with the other vSAN members. This main step allows us to identify if there are failures in the communication with any ESXi. The command to execute is the following:
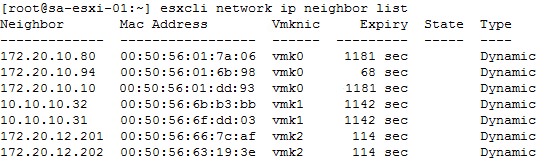
esxcli network ip neighbor list
The output of the command should list all the Mac Addresses of the vmknic of each ESXi and the type should be Dynamic.
The following image shows an example:
It is important to clarify that if the Mac Address column shows Incomplete and the Type column shows Invalid, this means that the host has communication problems.
It is important to clarify that if the Mac Address column shows Incomplete and the Type column shows Invalid, this means that the host has communication problems.
Step 5: Check communication with the vSAN vmk. This step is used to validate how the communication is at the level of the vmk designated exclusively for vSAN. It is important to know previously which is the vmk designated for vSAN. The command to run is the following:
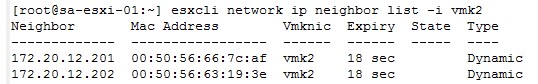
esxcli network ip neighbor list -i vmk2 (vsan’s vmk)
The output of this command should give us the IP, the Mac Address, the Vmknic and the type for each of the ESXi’s that are part of the vSAN cluster.
An example is shown in the following illustration:
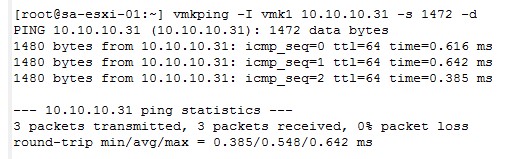
Step 6: Check communication with a specific vSAN member. This step is used to validate the communication with a particular vSAN member and each of its vmk. We can check vmk1, vmk2, vmk3 and the others that ESXi has. The command to execute is the following:
vmkping -I vmk2 XXdestinationXX -s -d
Where the -d option is to use the Dont’t Fragment bit in IPV4.
The -s option is to indicate the MTU size used in ESXi.
In the following image you can see the output of this command (the communication is being checked through the vmk1):
Example with partitioned vSAN
The following is a scenario where the VMware vSAN is partitioned.
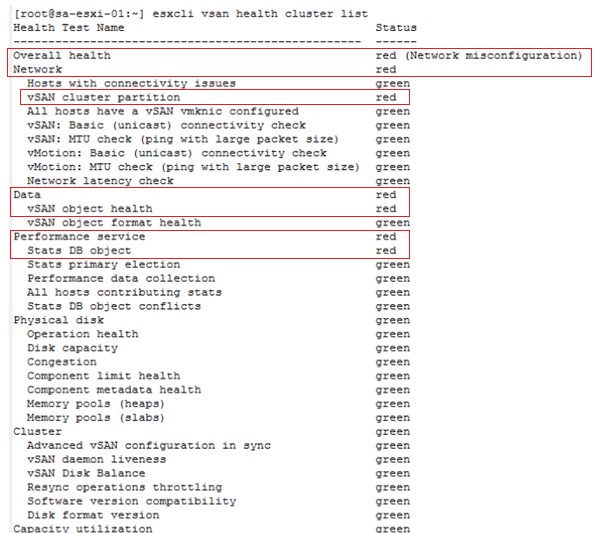
Step 1: After logging in via SSH to the host, we run the command
esxcli vsan health cluster list and we find that there is a general networking problem, and the cluster is partitioned.
In the following image you can see the details of the reported failure:
esxcli vsan health cluster list
The above command tells us that the cluster is partitioned, so we continue throuble shooting and run the following command:
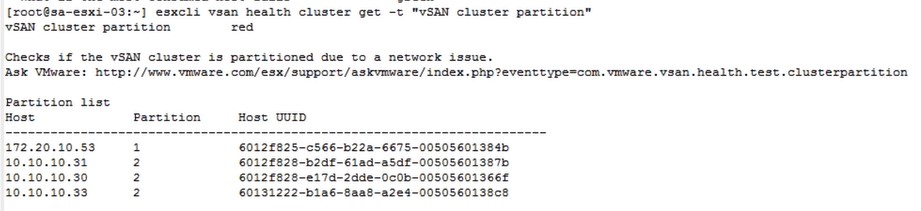
esxcli vsan health cluster get -t “vSAN cluster partition”.
The above command allows us to identify which hosts are partitioned, i.e. do not have communication at the vSAN level.
The following illustration shows that the host whose IP is 172.20.10.53 is partitioned, that is, isolated from the other vSAN members due to network failures:
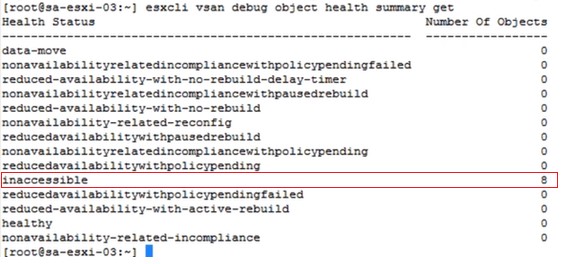
Step 2: We then run the command esxcli vsan debug object health summary get
and we get that there are 8 inaccessible objects which indicates that they are NOT accessible in the vSAN datastore.
The following image details the message:
Step 3: Check the communication with the other vSAN members by running the following command esxcli network ip neighbor list and we find that there is a host with communication problems.
The following image details the errors: